Exploring Fixed Size Logging
Sep 8, 2025
20 min
In a recent personal project, I needed a logging system that would never exceed a certain file size limit. The logs were meant to serve both as a debugging tool and as a rolling history of events. Because the system would be writing large volumes of events continuously, performance was critical. An additional requirement that made sense to me was also logging the most events in chronological order (most recent would be at the end of the file and the oldest at the beginning).
Naive Implementation
I started off with a naive 1-shot implementation that works as follows:
- Append new data: Events are written sequentially to the file.
- Check size limit: If the file grows beyond the maximum size, calculate how many bytes need to be discarded.
- Shift data: Read the remaining valid data (everything after the discarded portion) into memory.
- Rewrite file: Move this valid data back to the beginning of the file, then append the new log entry at the end.
class Logger1 {
private:
  std::fstream file;
  std::string filename;
  std::size_t maxSize;

public:
  Logger1(const std::string &filename, std::size_t maxSize) {
    file.open(filename, std::ios::binary | std::ios::out);
    file.close();
    file.open(filename, std::ios::binary | std::ios::in | std::ios::out);
    if (!file) {
      throw std::runtime_error("Constructor: cannot open file: " + filename);
    }
    this->filename = filename;
    this->maxSize = maxSize;
  }
  ~Logger1() {
    if (file.is_open()) {
      file.close();
    }
  }
  void write(const std::string &data) {
    std::size_t dataSize = data.size();
    std::size_t currentSize = file.tellg();
    if (currentSize + dataSize > maxSize) {
      std::size_t bytes = (currentSize + dataSize) - maxSize;
      file.seekg(bytes, std::ios::beg);
      std::vector<char> buffer(currentSize - bytes);
      file.read(buffer.data(), currentSize - bytes);
      file.close();
      file.open(filename, std::ios::binary | std::ios::out | std::ios::trunc);
      file.seekp(0, std::ios::beg);
      file.write(buffer.data(), buffer.size());
      file.close();
      file.open(filename, std::ios::binary | std::ios::in | std::ios::out);
      file.seekp(0, std::ios::end);
    }
    file.write(data.data(), dataSize);
  }
};
A quick test was written where it would log 1,000 messages into a 100 KB file which it did with an average time of 324.396ms. I’ll get into some better benchmarking later in this article, but the 324.396ms will serve as a baseline for future numbers before I introduce the official benchmarking numbers.
Adding Buffers
One of the first optimizations I introduced was a buffer. Instead of writing every log event directly to disk, events are first staged in memory. When the buffer fills up, its contents are flushed to disk in a single operation. This reduces the frequency of disk writes and speeds up the entire process, since the logger is no longer bottlenecked by constant I/O.
Why does this help? Buffers live in RAM, which is much closer to the CPU than disk storage. As a result, memory read/writes are orders of magnitude faster than disk operations. By batching writes in RAM and committing them less often, we take advantage of that speed difference. In fact, most file I/O libraries already use internal buffers for exactly this reason. By adding our own buffer, however, we gain more control over when and how data is flushed to disk.
For all future loggers I implement, I’ve decided to use an 8 KB internal buffer. However, as you can imagine, larger buffers reduce the number of file operations, since more data can accumulate before a flush is required translating to better performance. Of course, as with most optimizations, there are trade-offs. Increasing buffer size means allocating more memory, and excessive buffering can starve other parts of the system. Striking the right balance is important—big enough to minimize disk writes, but not so large that it wastes resources. I’ll revisit these trade-offs later in the article.
class Logger2 {
private:
  const int BUFFER_SIZE = 8 * 1024; // 8KB buffer size
  std::string filename;
  std::fstream file;
  std::size_t maxFileSize;
  std::vector<char> buffer;
public:
  Logger2(const std::string &filename, std::size_t maxFileSize) {
    file.open(filename, std::ios::binary | std::ios::out | std::ios::trunc);
    file.close();
    file.open(filename, std::ios::binary | std::ios::in | std::ios::out);
    if (!file) {
      throw std::runtime_error("Constructor: cannot open file: data.log");
    }
    this->filename = filename;
    this->maxFileSize = maxFileSize;
  }
  ~Logger2() {
    if (file.is_open()) {
      flush();
      file.close();
    }
  }
  void write(const std::string &data) {
    std::size_t dataSize = data.size();
    // check if buffer is full
    if (static_cast<int>(buffer.size() + dataSize) > BUFFER_SIZE) {
      // flush the buffer
      flush();
    }
    // add new data to buffer
    buffer.insert(buffer.end(), data.begin(), data.end());
  }
  void flush() {
    // check if exceeds file size
    int currFileSize = file.tellg();
    if (buffer.size() + currFileSize > maxFileSize) {
      // if it does, rewrite old data with new data
      int bytesToRemove = buffer.size() + currFileSize - maxFileSize;
      file.seekg(bytesToRemove, std::ios::beg);
      std::vector<char> remainingData(currFileSize - bytesToRemove);
      file.read(remainingData.data(), currFileSize - bytesToRemove);
      file.close();
      file.open(filename, std::ios::binary | std::ios::out | std::ios::trunc);
      file.seekp(0, std::ios::beg);
      file.write(remainingData.data(), remainingData.size());
      // close the file and reopen in append mode
      file.close();
      file.open(filename, std::ios::binary | std::ios::in | std::ios::out);
      file.seekp(0, std::ios::end);
    }
    file.write(buffer.data(), buffer.size());
    buffer.clear(); // clear the buffer after writing
  }
};
Running the above code on the same parameters (1,000 messages to a 10KB file), we get a huge boost in performance. On average the code finished running in 19.364 ms which is a 1675% increase from the naive implementation!
Reducing Number Of Flushes
Flushing is the act of emptying a buffer into disk storage. When a flush happens, all the data currently in memory is written out, regardless of how much the buffer contains. In my earlier implementation, flushing was triggered indirectly by closing the file. This behavior makes sense: when a file is closed, the operating system ensures that any buffered data is written to disk so nothing is lost. However, constantly closing and reopening files just to force a flush is inefficient. Instead of juggling file open/close cycles with different modes, I switched to keeping the file open in truncate mode and overwriting the necessary data in place through the file pointer. This simplifies the design, avoids unnecessary flushes, and gives me more control over when data is written out.
class Logger3 {
private:
  const int BUFFER_SIZE = 8 * 1024;
  std::string filename;
  std::fstream file;
  std::size_t maxFileSize;
  std::vector<char> buffer;
public:
  Logger3(const std::string &filename, std::size_t maxFileSize) {
    file.open(filename, std::ios::binary | std::ios::out | std::ios::trunc);
    file.close();
    file.open(filename, std::ios::binary | std::ios::in | std::ios::out);
    if (!file) {
      throw std::runtime_error("Constructor: cannot open file: data.log");
    }
    this->filename = filename;
    this->maxFileSize = maxFileSize;
  }
  ~Logger3() {
    if (file.is_open()) {
      flush();
      file.close();
    }
  }
  void write(const std::string &data) {
    std::size_t dataSize = data.size();
    if (static_cast<int>(buffer.size() + dataSize) > BUFFER_SIZE) {
      flush();
    }
    buffer.insert(buffer.end(), data.begin(), data.end());
  }
  void flush() {
    int currFileSize = file.tellg();
    if (buffer.size() + currFileSize > maxFileSize) {
      int bytesToRemove = buffer.size() + currFileSize - maxFileSize;
      file.seekg(bytesToRemove, std::ios::beg);
      std::vector<char> remainingData(currFileSize - bytesToRemove);
      file.read(remainingData.data(), currFileSize - bytesToRemove);
      file.seekp(0, std::ios::beg);
      file.write(remainingData.data(), remainingData.size());
      file.seekp(remainingData.size(), std::ios::beg);
    }
    file.write(buffer.data(), buffer.size());
    file.seekp(0, std::ios::end);
    buffer.clear();
  }
};
Running the above code on the same parameters results in an average run time of 1.172 ms. That’s around a 1652% boost in performance compared to the previous buffer implementation.
Profile & Flamegraph
Originally, I was satisfied with ending the experiment at this stage, but curiosity got the better of me. I wanted to see how much further I could push performance (in a reasonable amount of time). One of the most common ways to uncover hidden bottlenecks is by profiling and visualizing runtime behavior with a flame graph. Profilers are extremely useful tools: they show exactly which parts of the code consume the most time during execution. For this experiment, I used the perf command on Linux along with Brendan Gregg’s Flamegraph repository. Running my logger through the profiler quickly highlighted where the inefficiencies were hiding.
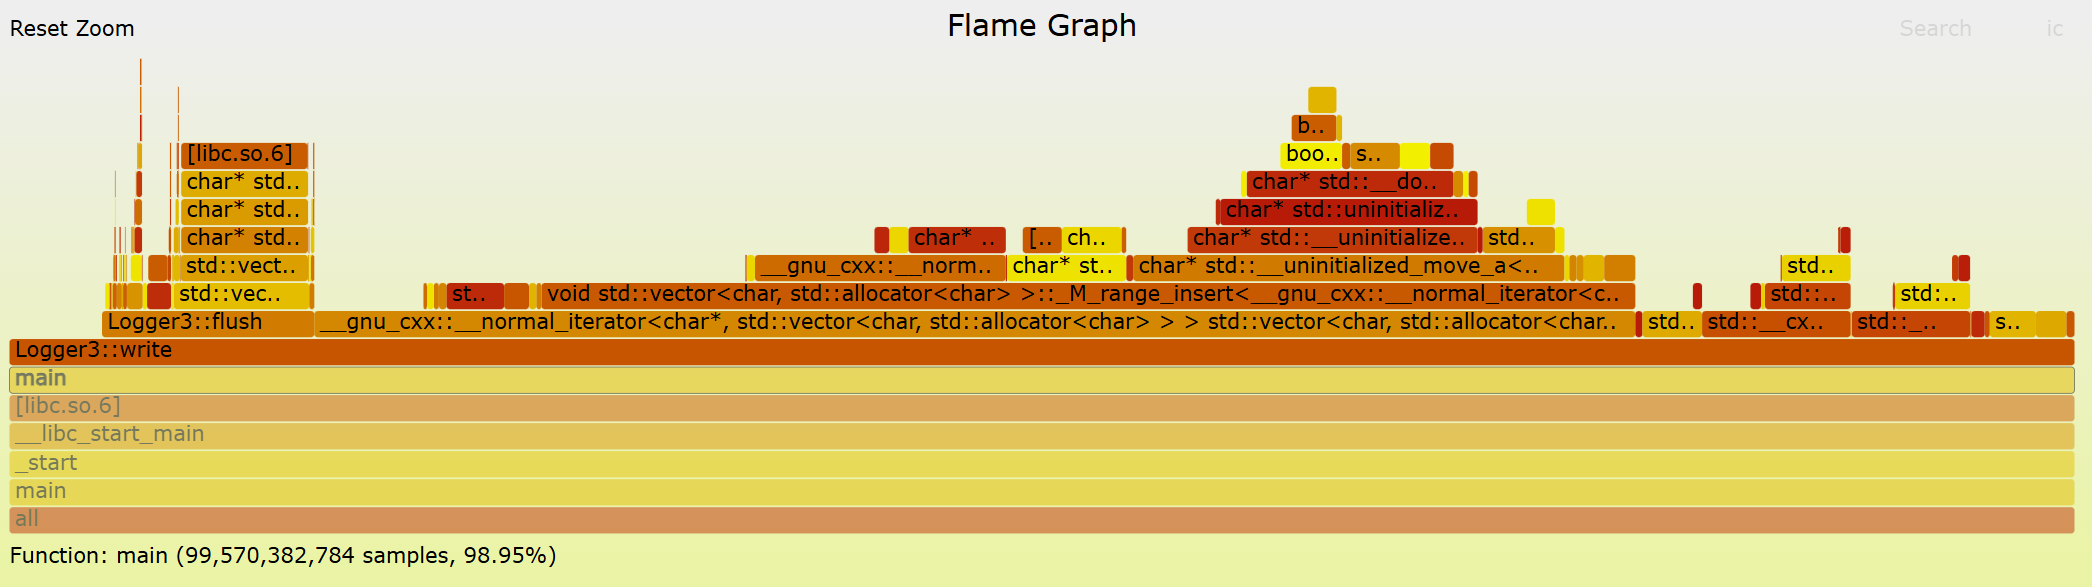
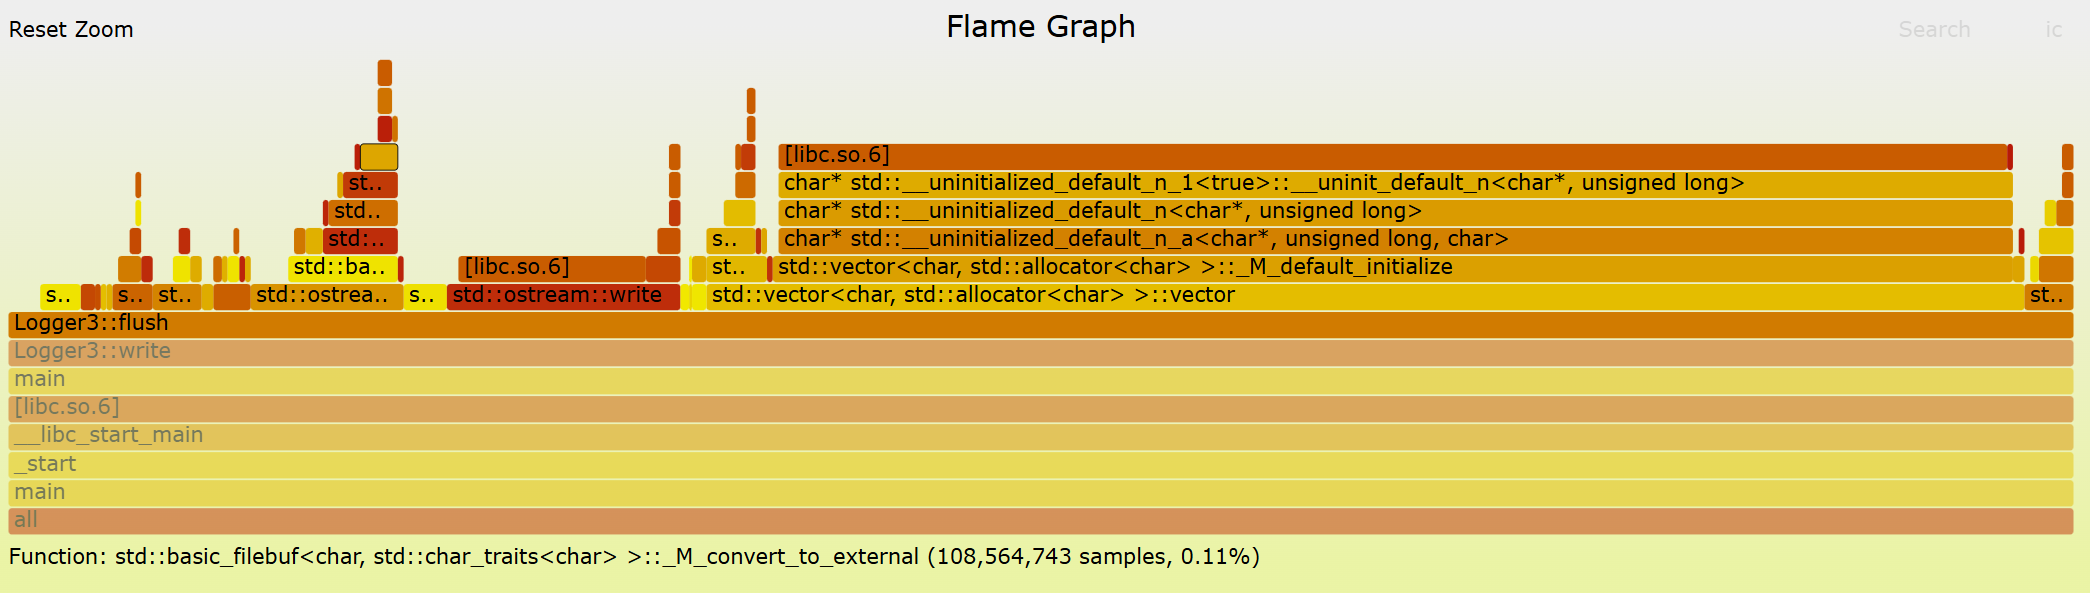
Vector allocation was eating up a significant portion of both the write and flush functions. This makes sense, since dynamically resizing vectors at runtime introduces frequent allocation overhead. The fix was simple: instead of letting the vectors resize on demand, I pre-allocated the maximum required memory in the constructor for both the buffer and the temporary read vector. This way, the overhead is paid once upfront, rather than repeatedly during logging.
class Logger4 {
private:
  const int BUFFER_SIZE = 8 * 1024; // 8KB buffer size
  std::string filename;
  std::fstream file;
  std::size_t maxFileSize;
  std::vector<char> buffer;
  std::size_t bufferSize;
  std::vector<char> temp;
public:
  Logger4(const std::string &filename, std::size_t maxFileSize) {
    file.open(filename, std::ios::binary | std::ios::out | std::ios::trunc);
    file.close();
    file.open(filename, std::ios::binary | std::ios::in | std::ios::out);
    if (!file) {
      throw std::runtime_error("Constructor: cannot open file: data.log");
    }
    this->filename = filename;
    this->maxFileSize = maxFileSize;
    buffer.resize(BUFFER_SIZE);
    bufferSize = 0;
    temp.resize(maxFileSize);
  }
  ~Logger4() {
    if (file.is_open()) {
      flush();
      file.close();
    }
  }
  void write(const std::string &data) {
    std::size_t dataSize = data.size();
    if (static_cast<int>(bufferSize + dataSize) > BUFFER_SIZE) {
      flush();
    }
    std::memcpy(buffer.data() + bufferSize, data.data(), dataSize);
    bufferSize += dataSize;
  }
  void flush() {
    int currFileSize = file.tellg();
    if (bufferSize + currFileSize > maxFileSize) {
      int bytesToRemove = bufferSize + currFileSize - maxFileSize;
      int oldDataSize = currFileSize - bytesToRemove;
      file.seekg(bytesToRemove, std::ios::beg);
      file.read(temp.data(), oldDataSize);
      file.seekp(0, std::ios::beg);
      file.write(temp.data(), oldDataSize);
    }
    file.write(buffer.data(), bufferSize);
    bufferSize = 0;
  }
};
Running the above code on the same parameters results in an average of 0.384 ms, a 305% increase in performance compared to the previous implementation.
Observations
At this point, I stopped chasing further optimizations and decided to run a little benchmark. Even though there are certainly many more ways to squeeze out performance, time was running short and the logger was already performing well enough for my use case. That said, there are still interesting directions worth exploring. For example, instead of making the write operation handle tricky reads, one could implement a custom reader with a pointer to the artificial start of the file. This would shift some complexity away from writes, potentially making them even faster. The benchmark itself evaluates the run time of each logger implementation using 4 different workloads: 100, 1,000, 10,000, and 100,000 messages with a fixed file size of 100 KB. Each test was run 100 times to smooth out potential anomalies.
| num_messages | Logger 1 | Logger 2 | Logger 3 | Logger 4 |
|---|---|---|---|---|
| 100 | 0.10808 | 0.34586 | 0.35084 | 0.08532 |
| 1,000 | 324.396 | 19.364 | 1.172 | 0.384 |
| 10,000 | 6273.71632 | 374.71815 | 19.76829 | 14.89675 |
| 100,000 | 64398.67743 | 4055.53382 | 194.87804 | 148.69144 |
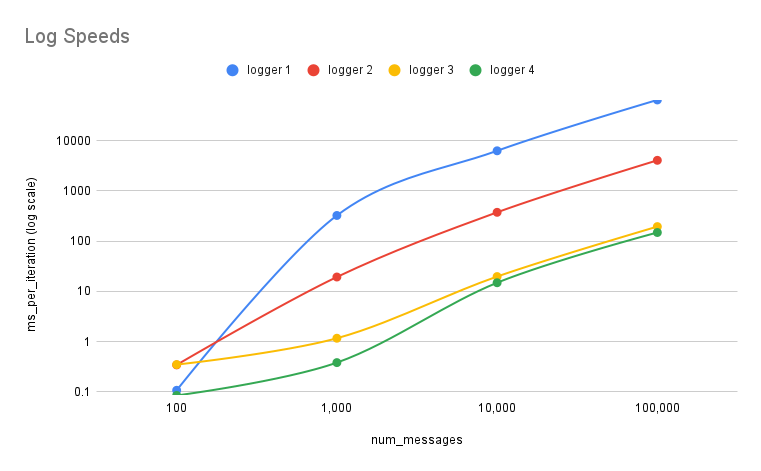
As expected, Logger 4, the most optimized version, performed the best overall, especially as the number of messages increased. Interestingly, at the very small scale (100 messages), the naive implementation actually outperformed Loggers 2 and 3. This outcome makes sense: with such a small workload, the overhead of buffer allocation and management outweighed the benefits, since the file never came close to overflowing. However, once the number of messages grew, the story flipped. From 1,000 messages onward, Loggers 2 through 4 consistently outperformed the naive version by orders of magnitude as the advantages of buffering and start memory management kicked in.
Thanks for reading. Cya 👋.